Some examples of our work
Listed below are some of the applications we have completed for our clients. Many are still being used on a daily basis.
 Real time data display
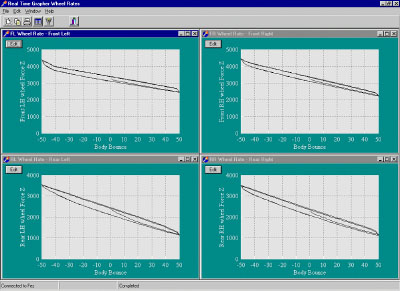
The screenshot on the right shows an application that plots data from a test rig in real time. The application runs on a remote PC and connects to the test rig via Ethernet. The test rig can output about 120 channels of data. The application stores the graph properties (channels, colours, position/size of window etc) in a database, and a set of graphs can be grouped into a "test set-up". This allows the application to show the relevant graphs for each type of test automatically. |
 Data Presentation and Analysis
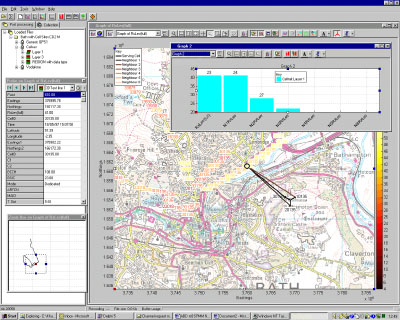
The screenshot on the left shows an application for presenting data from mobile network coverage tests. The application is showing two graphs: 1. bar graph of the mobile Rx Level with BSIC shown numerically. 2. route map of the test showing the mobile Rx Level as a colour with the Cell ID shown numerically. On the route map the point with the black circle round it is the position of the Probe (the Probe window is shown at the top left). The base stations are also shown in the plot, with the solid lines connecting the Probe point to the base station showing the serving cell and neighbours 1 and 2. The Zoom box (shown at the bottom left) allows the user to pan and zoom using the mouse (although auto-scale is provided). This application can also collect data from numerous devices (phones, scanners, GPS etc), and shows similar plots in real-time. The configuration of the application can also be saved, allowing previous graphs to be loaded again. |
 Technical Web Site
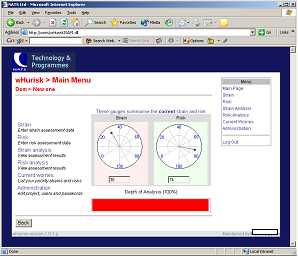
The website shown on the right captures the “strain” and “risk” in a project by processing the scores users give to sets of carefully written questions. It displays the strain and risk graphically to reveal what individuals really feel about the status of a project; something that’s an extremely useful “early warning system” in large projects. The website uses ISAPI, JavaScript and Java, and all information is stored in a SQL database. It also required us to write our own security and tracking software to identify each user without the use of “cookies”. |
 Graphical Data Presentation in Websites
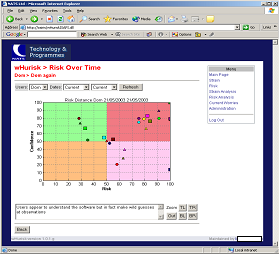
HyperGraphics, a graphics library developed by Dot Software, is particularly suited to the display of complex and abstract data. The graph shown to the right is a user’s “ risk”, and demonstrates HyperGraphics’ power to create very unique displays. |
 Website Usability
The success of a website largely depends on users finding it simple to use so they can quickly get the information they need. The website shown on the right is our software modification system; a site that is used every day by all our developers, sometimes from home on slow modem connections. We have learnt a great deal about creating fast, intuitive, websites from its development. |
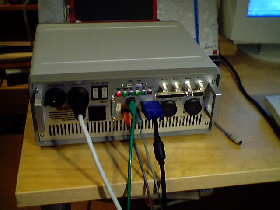 Mobile Equipment
Hardware and software for use in vehicles for the collection of mobile network performance data. This included a PICC-based Lithium-ion battery charger. |
| Inertia calculation library
Processing code for an inertia-measuring machine. A code library that calculates the principal axes and moments of inertia of a complete vehicle from the forces and moments measured by the machine. |